Ēriks Kupïea and Steve Smallcombeb
aVarian Inc., NMR Instruments, 28 Manor Road, Walton-on-Thames, Surrey KT12 2QF, UK
bVarian Inc., NMR Instruments, 3120 Hansen Way, Palo Alto, CA 94304-1030, USA
In the 50 plus year history of nuclear magnetic resonance (NMR), higher magnetic fields have always been quickly adopted by the NMR community as they have brought new levels of fundamental NMR performance, i.e. sensitivity and dispersion. Over that time magnetic field strengths have progressed from the early days when protons resonated at 30 MHz to today, when NMR spectrometers working at 600, 750 or even 800 MHz spectrometers are fairly common.a These higher magnetic fields have allowed NMR scientists to solve the structure of larger and larger molecules, and today NMR is one of the two techniques that is being used experimentally to determine the structure of proteins, nucleic acids and other large biomolecules. (The other technique is x-ray crystallography.)
aNMR uses the magnetic resonance properties of certain NMR-sensitive nuclei to study the chemical and physical properties of samples of interest. NMR spectroscopists refer to the nucleus of a hydrogen atom with an atomic weight of one, as a proton, as that of course, is what it is.
Given the vast number of new protein molecules being revealed by the advances in Genomics and Proteomics, the future of NMR, and especially high-field NMR, is brighter than ever before. With these new challenges in mind, the recent demonstration of the first 900 MHz NMR spectra by Varian and Oxford Instruments, was, of course, welcomed by the NMR community. Actually, it would be hard to remember a new field strength as eagerly anticipated as that of 900 MHz. The reason is that at 900 MHz, not only are fundamental NMR parameters expected to improve, but at these relatively high magnetic field strengths, molecules start revealing information in a way that is particularly useful in determining the structures of large proteins and other large biopolymers.
One of the first steps in solving the structure of any molecule is isolating, or separating, the NMR resonance from each NMR sensitive atom in the molecule, and then assigning those resolved resonances to the various individual atoms. Once each NMR sensitive atom in a molecule is assigned a characteristic NMR frequency, other NMR experiments can be used to determine the through-space relationships among the various atoms, thus giving clues as the topology or 3-dimensional structure of the molecule.1 If the resonance of several atoms are overlapped, the possibility exists for an incorrect assignment and therefore an incorrect structure. This can be particularly challenging as molecular weight increases to the size of even small proteins, which may contain a thousand or more protons, and hence proton NMR resonances. It is separating these many resonances that make higher and higher magnetic fields desirable in general, and essential for the study of biopolymers.
To understand the power of NMR at higher magnetic fields, let us start by seeing the effect increasing magnetic field strength has on the spectrum of a relatively small molecule, phenylalanine; the proton NMR spectra of which is shown in Figure 1.
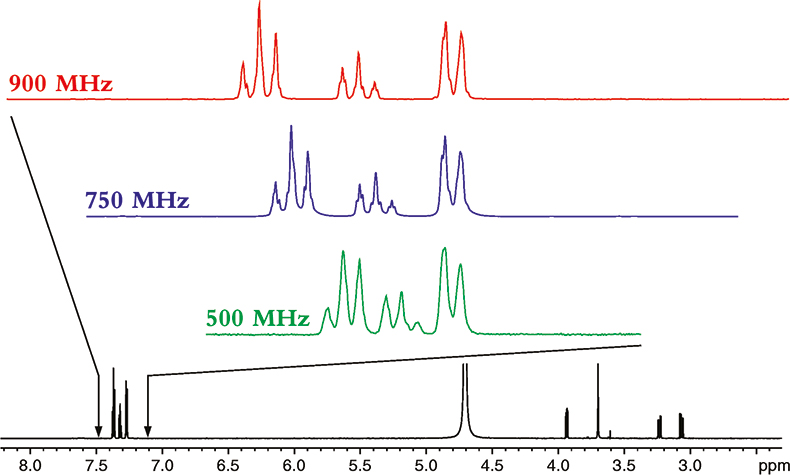
Figure 1. The proton NMR spectrum of phenylalanine at 900 MHz. The horizontal axis represents the relative frequency of the various NMR resonance positions, which in turn reveals its chemical environment. The expansions show the additional dispersion and spectral simplification that occurs as the magnetic field strength is increased from 500 to 900 MHz. The higher the magnetic field the more disperse or separated the NMR spectrum becomes.
The spectrum in Figure 1 is what NMR people refer to as a 1-dimensional NMR spectrum, in that the various resonances are separated or resolved along a single frequency axis. As one can see in Figure 1, at higher magnetic fields, the NMR spectrum is better separated or dispersed along this single frequency axis.
Increasing the magnetic field not only provides a better spectral resolution but also improves the overall sensitivity of NMR experiments by roughly the 3/2 power of the magnetic field strength. For instance, an increase in the field strength on a 900 MHz instrument as compared to that on a 600 MHz spectrometer improves the signal-to-noise figure by approximately 84%. Even a modest increase in the field strength when comparing 800 MHz and 900 MHz instruments gives an advantage of almost 20% in the signal-to-noise ratio.
The signal-to-noise ratio can be improved further by reducing the noise level. The introduction of cryogenically-cooled probe technology2,3 potentially can improve the overall signal-to-noise ratio of the 900 MHz instrument by another factor of four. This new technology is by no means an alternative to increasing the magnet field strength, but rather a complementary technique.
Multi-dimensional NMR
While 1-dimensional NMR still plays an important role, many NMR spectra are often collected and displayed as a function of multiple frequencies or dimensions, so called multi-dimensional NMR.4 The advantage of multi-dimensional NMR is that the various NMR resonances can now be separated along several NMR frequency axes, thus spreading them over the surface of a plane, i.e. 2-D NMR, or a cube, 3-D NMR or perhaps even higher dimensions.
Multi-dimensional NMR is essential for large molecules as the proton NMR spectra of even small proteins exhibit substantial overlap in most spectral regions. Heteronuclear correlation spectra can potentially help solve the overlap problem by spreading the various resonances associated with a pair of directly-bonded nuclei, e.g. an NH moiety, over two dimensions, e.g. a proton chemical shift and a nitrogen chemical shift. Each NH bond in the molecule produces one NH “spot” on the correlation spectrum.
Unfortunately, however, the natural abundance of the NMR sensitive isotopes of carbon, 13C, and nitrogen, 15N, are rare, making such experiments relatively insensitive in protein molecules as they occur naturally. Fortunately, biotechnology has come to the rescue and today, most proteins of interest can be “expressed” and grown biosynthetically, with 13C- and 15N-enriched media, thus producing proteins that are isotopically enriched and only contain NMR-sensitive 13C and 15N atoms.5 The use of such double-labelled proteins, and the experiments used to assign each backbone atom to a specific resonance frequency are a key element of NMR structural work in biopolymers.
With the introduction of multidimensional and heteronuclear NMR techniques in the 1980 and early 1990s, the resolving power of NMR was dramatically increased, making it possible to study complex bio-molecules such as proteins and DNAs. However, the spectral dispersion and sensitivity still very much depend on the resolving power of the magnetic field. Figure 2 shows the 2D 15N–1H correlation map of a 101 residue protein acquired at 900 MHz. In this case the proton nitrogen correlation experiment chosen is an experiment called TROSY (Transverse Relaxation Optimised SpectroscopY) that is particularly advantageous at 900 MHz for reasons that will be explained below.
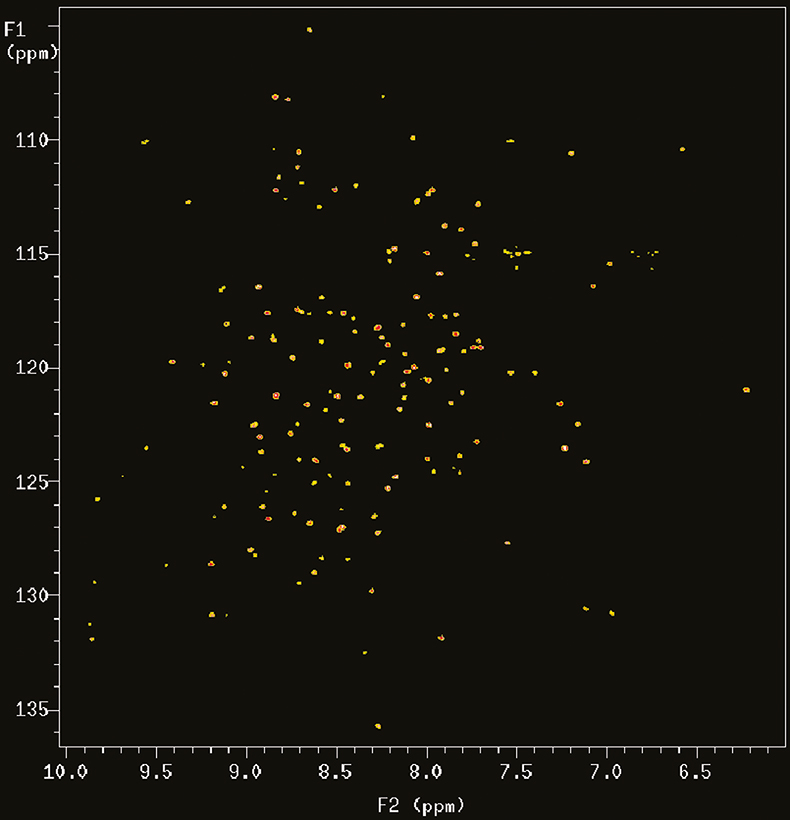
Figure 2. 15N–1H TROSY correlation spectrum of a 19 kDa protein (6F11F22F2 module of gelatin binding domain of fibronectin, see Reference 6) recorded on Varian Unity INOVA spectrometer at 900 MHz. The sample is courtesy of Professor I.D. Campbell, J. Werner and A. Pickford, Oxford University, UK.
NMR of larger proteins
As one moves to larger and larger molecules, not only do the spectra become more complex with more overlap, but the nuclei of interest relax more quickly during the NMR experiments, thus broadening the observed resonance lines. This line broadening not only increases overlap, but can also severely limit the sensitivity of the rather complex experiments needed to characterise doubly-labelled proteins when applied to large proteins. Thus, prior to the advent of the more recent development to be discussed below, it seemed as if approximately 40 kDa in molecular weight would be the practical limit for NMR-based structures. Since many proteins of interest are above this practical limit, this was seen as a significant limitation for NMR-based structural work.
As NMR has often done in the past 50 years when facing what seemed like a significant limitation, clever people found a way around it. In this case, the new experiments are based on the differential relaxation behaviour of the two components of the NH doublet.
The two most important relaxation mechanisms in proteins are the dipole–dipole (DD) and chemical shift anisotropy (CSA), with the magnitude of the CSA term being strongly magnetic field dependent. Interference between these two relaxation mechanisms gives rise to different relaxation rates of the two components of a N–H doublet,7 producing a phenomenon known as differential line broadening. Since the various relaxation rates also depend on the molecular correlation times (tumbling rates), this effect is amplified in larger molecules.
NMR scientists at the ETH in Zurich realised that since the two terms are of opposite sign for one of the components and are field dependent, it raised the possibility that at some “magic field” these two terms might largely cancel and a properly constructed 15N correlation experiment could be acquired with relatively narrow lines, even for proteins of 100 kDa!8 It turns out the “magic field” is at about 900 MHz, and the experiment that selects the narrow component of the relaxation matrix is TROSY. This opens a whole new avenue for studying extremely large (from a NMR point of view) proteins.
TROSY at 900 MHz
Figure 3 compares two heteronuclear correlation spectra of a small protein acquired at 900 MHz. The heteronuclear single quantum coherence (HSQC) spectra on the left used conventional techniques to obtain the NH correlations and “decouple” any proton–nitrogen interactions, giving a lineshape to the resultant decoupled peak that is a mixture of the lineshapes in the sharp and broad components. The TROSY spectra on the right, on the other hand, uses the NMR pulse sequence to select preferentially only the slowly relaxing or sharp component of the 15N–1H multiplet without using decoupling. Thus TROSY peaks can be much sharper than peaks in experiments that use decoupling to eliminate 15N–1H coupling.
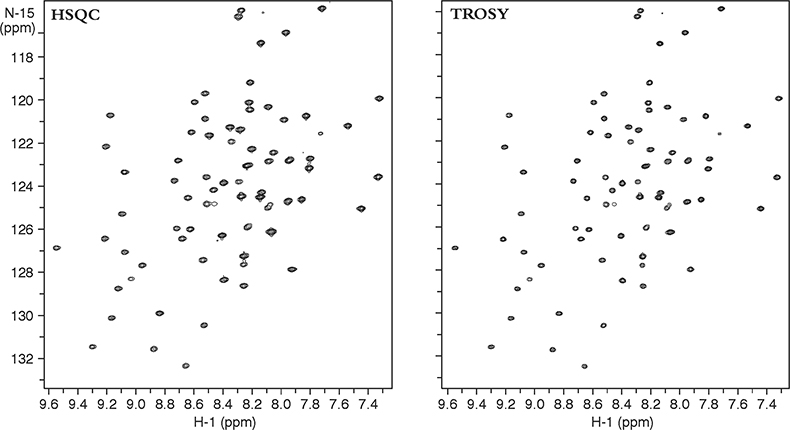
Figure 3. 15N–1H 2D HSQC and TROSY spectra of a 11 kDa protein, YciH, a putative translation initiation factor from E. coli. The sample is courtesy of Dr M. Kennedy, Battelle Northwest National Laboratories, USA.
Whereas TROSY provides some benefits at lower magnetic field strengths and with smaller proteins, it is between 900 MHz and 1 GHz and with larger molecules or complexes where the TROSY effect is the most beneficial. This can be seen from the data in Figure 4 that show four multiplet components from coupled HSQC spectra at 500, 750 and 900 MHz, and for two multi-domain protein samples of different molecular weight. In the two spectra on the left, taken of a two-protein domain complex, the differential line broadening effects can be seen to be larger at 900 MHz than 500 MHz, but the effect is not dramatic. In the two spectra on the right, however, taken of a four-domain protein complex, the differential line broadening effects are both more pronounced and much more field dependent. In this case, even the much smaller difference between 750 and 900 MHz shows noticeable changes in differential line broadening.
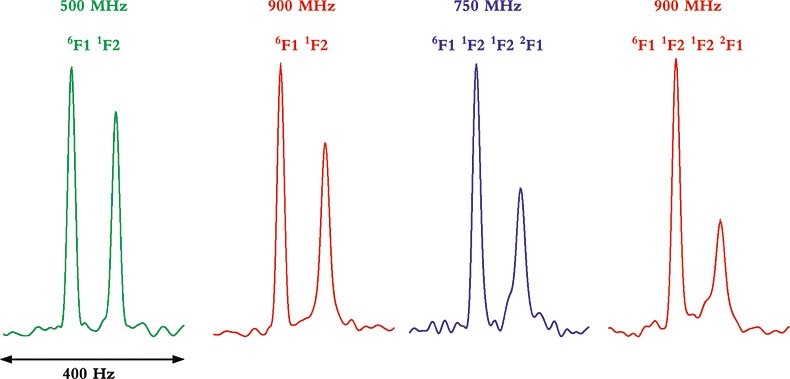
Figure 4. Comparison of the differential line broadening effect in 6F11F2 and 6F11F21F22F1 modules of the gelatin binding domain of fibronectin at 500, 750 and 900 MHz. The samples are courtesy of Professor I.D. Campbell, J. Boyd, J. Werner and A. Pickford, Oxford University, UK.
Partially-oriented samples
Another very important application of high-field NMR is the measurement of residual dipolar couplings in partially-oriented samples. Normally we think of molecules in a liquid as tumbling isotropically or randomly, without a preferred orientation. This is the basis of high-resolution NMR, as the random tumbling produces an average chemical shift over all possible orientations, and the dipole–dipole coupling between the various nuclei in the sample is averaged as well, leaving the more familiar (to liquids spectroscopists that is) scalar (J) coupling terms. Things can start to change, however, at very high magnetic fields where the molecules’ tumbling may no longer be isotropic.
Molecular mobility can be affected by the magnetic field because of the magnetic properties of molecules themselves. For instance, the magnetic susceptibility of paramagnetic proteins, DNA and RNA are largely anisotropic, can induce partial alignment of these molecules with the magnetic field. Such effects are very interesting, since they contain important structural information.
As mentioned above, we normally interpret line splittings in liquids as arising entirely from scalar (J) coupling as fast isotropic molecular tumbling averages the dipolar terms to zero. However, if the magnetic field is very strong, molecular alignment with the field can no more be neglected.
In weakly-aligned systems, the increase in the observable residual dipolar couplings is proportional to the square of the magnetic field, for example, the contributions from dipolar couplings are larger by a factor of 3.24 on a 900 MHz instrument relative to 500 MHz system. The residual dipolar couplings due to partial alignment with the magnetic field are clearly visible in the expansions of N–H correlated spectrum of a paramagnetic metallo-protein Cytochrome C (see Figure 5). The different magnitudes of the residual dipolar couplings reflect the angles between the magnetic susceptibility vector and the corresponding N–H bond vectors providing valuable structural information. This information is new and principally different from the traditional parameters used for structure determination, such as Nuclear Overhauser Effects (NOEs), J-couplings and chemical shifts, which provide local information regarding torsion angles and distances relative to other atoms in close proximity.
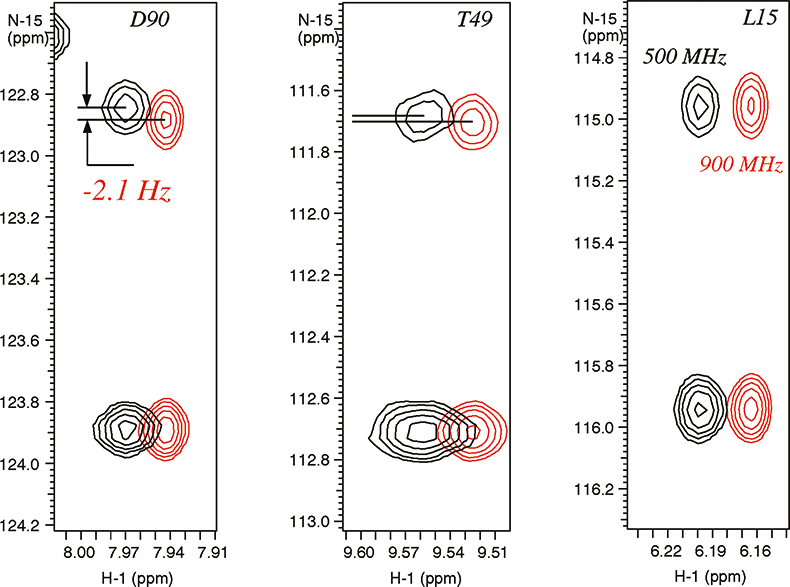
Figure 5. Residual dipolar couplings observed due to magnetic molecular alignment in para-magnetic metallo-protein cytochrome C (103 residues) containing Fe3+ (see Reference 9). The spectra were recorded on Varian Unity INOVA spectrometers at 900 MHz (in red) and 500 MHz. The sample is courtesy of Dr G.J. Pielak, University of North Carolina, USA.
The molecular alignment can further be amplified by using dilute liquid crystal media that are very strongly oriented, such as bicelles and phages.10 Working with a higher degree of alignment allows more accurate measurement of residual dipolar couplings. Unfortunately this can also cause substantial line broadening resulting from residual 1H–1H dipolar couplings thus reducing the effective resolution. Again the resolving power of high field systems becomes very important. As shown in Figure 6, band-selective 1H homo-nuclear decoupling provides further improvement of resolution and sensitivity.11 Just as in the case of the cryogenically-cooled probes, this is not an alternative to increasing the field strength, but rather a complementary technique that can be used at any field strength to improve spectral resolution and sensitivity.
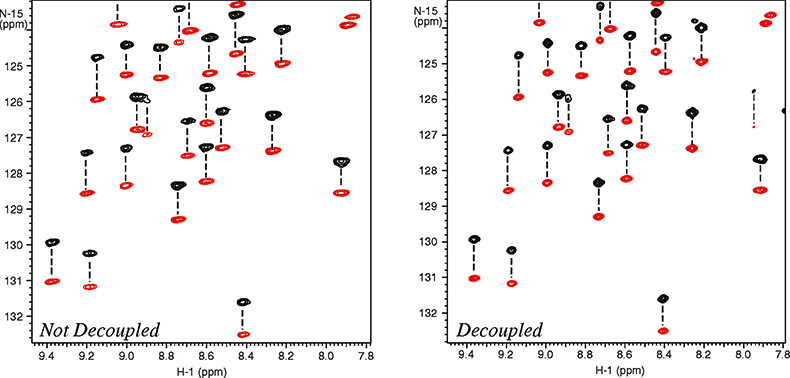
Figure 6. Measurement of residual dipolar 15N–1H couplings in a 101 residue protein, 6F11F2 module of the gelatin binding domain of fibronectin, dissolved in dilute liquid crystalline media (bicelles). The spectra were recorded at 900 MHz with (right spectrum) and without (left spectrum) homo-nuclear 1H–1H decoupling. The negative peaks are in red. The sample is courtesy of Professor I.D. Campbell, J. Werner and A. Pickford, Oxford University, UK.
Conclusions
Increasing the magnetic field strength continues to improve the sensitivity and resolution in NMR spectra. Reducing the spectral overlap allows one to study ever larger and larger biomolecular systems such as proteins and DNAs. Furthermore, at extremely high magnetic field strengths new information that is not easily accessible at lower magnetic fields can be obtained and employed for structure elucidation of large biologically important molecules, such as proteins, DNAs and RNAs. The orientation effects of molecules in a strong magnetic field cause variation of parameters, such as chemical shifts and coupling constants, which used to be considered as field independent. NMR is entering a new stage, and it becomes a very different technique at these high magnetic field strengths.
Acknowledgements
Authors would like to thank Dr J. Boyd and Dr C. Redfield of Oxford University for providing the spectra recorded at 750 MHz frequency. E.K. thanks Dr J. Boyd for many inspiring discussions.
References
- L.E. Kay, G.M. Clore, A. Bax and A. Gronenborn, Science 249, 411 (1990).https://doi.org/10.1126/science.2377896
- P. Styles, N.F. Soffe, C.A. Scott, D.A. Cragg, F. Row, D.J. White, P.C.J. White, J. Magn. Reson. 60, 397 (1984).
- W.A. Anderson, W.W. Brey, A.L. Brooke, B. Cole, K.A. Delin, L.F. Fuks, H.D.W. Hill, V.Y. Kotsubo, R. Nast, R.S. Withers and W.H. Wong, Bull. Magn. Reson. 17, 98 (1995).
- E.D.P. Zuiderweg, A.M. Petros, S.W. Fesik and E.T. Olejniczak, J. Am. Chem. Soc. 113, 370 (1990).https://doi.org/10.1021/ja00001a060
- T. Yamazaki, W. Lee, C.H. Arrowsmith, D.R. Muhandiram and L.E. Kay, J. Am. Chem. Soc. 116, 11655 (1994).https://doi.org/10.1021/ja00105a005
- J.R. Potts and I.D. Campbell, Curr. Opin. Cell. Biol. 6, 648 (1994).https://doi.org/10.1016/0955-0674(94)90090-6
- M. Goldman, J. Magn. Reson. 60, 437 (1984).
- K. Pervushin, R. Riek, G. Wider and K. Wüthrich, Proc. Natl. Acad. Sci USA 94, 12366 (1997).https://doi.org/10.1073/pnas.94.23.12366
- A.S. Morar, D. Kakouras, G.B. Young and G.J. Pielak, J. Biol. Inorg. Chem. 4, 220 (1999).https://doi.org/10.1007/s007750050307
- N. Tjandra and A. Bax, Science 278, 1111 (1997).https://doi.org/10.1126/science.278.5340.1111
- C.W. Vander Kooi, E_. Kupïe, E.R.P. Zuiderweg and M. Pellecchia, J. Biomol. NMR 15, 335 (1999).https://doi.org/10.1023/A:1008387305293


